
Project Description
Elastomeric foams with embedded photonic senors for 3D touch recognition
This work was completed as a final project for Bart Selman’s CS 6700: Advanced Artificial Intelligence graduate course at Cornell. For this project, I designed and fabricated a soft touch sensor using an elastomeric foam with embedded infrared (IR) LEDs and receivers. The soft touch sensor identifies the location and depth of a press into the foam. I developed a testing apparatus to collect training data by probing the sensor at known positions and collecting data from the IR receivers. For each press, eight distinct patterns are applied to 32 LEDs and the voltages across 32 phototransistors are recorded, yielding 256 training features. I then used random forests to generate a model to predict the probe’s location. First, I used a classification model to determine whether the probe is pressing the sensor (with >98% accuracy). For cases where the probe is pressing the foam, the root-mean-square error (RMSE) of the predicted location is <1.6mm, and the RMSE of the predicted depth is <0.6mm.
How it works

Elastomeric foams (e.g. silicone, polyurethanes) are a lightweight, highly stretchable material that are easily molded into 3D shapes for use as pneumatic actuators [1]. Previously, photoreflective sensors have been embedded in polyester padding to serve as sensors for soft objects such as pillows [2]. The image to left shows a a design for embedding infrared (IR) LEDs and receivers into an elastomeric foam. As the foam is compressed, the transmittance of the foam decreases. This decreased transmittance corresponds to an increase in resistance for the IR receiver. Measuring this resistance provides an indirect method to estimate the pressure applied to the foam and the ensuing deformation.
Experimental Overview
The mechanism described above can be extended to create a soft touch screen by using an array of IR LEDs and receivers placed around the edges of a piece of foam, as shown to the right. With the addition of more sensors and receivers, the relationship between resistance and force input is not directly proportional, as in the case of a single sensor. Although the IR receivers provide a rich source of information about the deformation experienced by the foam, the process of analytically building and calibrating a model would be very time intensive. For this reason, I selected a method of autonomously collecting data and building a model using machine learning. This model can estimate the location and depth of a finger press without directly modelling the physics of the system or calibrating for the exact LED and sensor locations.

Electronics
I used an Arduino DUE microcontroller to drive 32 IR LEDs (TSML1020; Vishay Semiconductors) and read voltages across each of the IR phototransistors (TSML1020; Vishay Semiconductors). I used two multiplexers (CD74HC4067; Texas Instruments) to interface with the phototransistors so that two analog input pins on the Arduino DUE can measure the voltage across each of the 32 phototransistors. The schematic below shows the design of five custom circuit boards that integrate the electronics for the soft touch sensor. Each of the four edge pieces hosts eight LEDs and eight phototransistors. These edge pieces attach to the connector board using right angle headers. The connector board also hosts the multiplexer breakout boards and Arduino DUE.

Mechanical Design
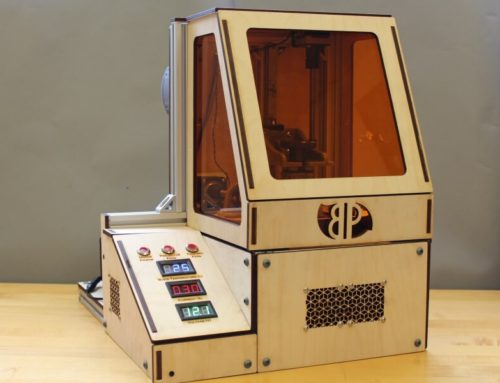
A laser cut acrylic enclosure houses the electronics and elastomeric foam for light transmission. The acrylic surface also procides a rigid surface under the foam that ensures reproducible results as the foam is deformed.The outer housing has an opening to allow connections to the USB port on the Arduino DUE. The elastomeric foam is a 12.5mm thick polyurethane sheet (8643K502; McMaster-Carr). I cut the foam cut slightly larger than the opening so that compression holds the foam in place. I covered the foam layer with a room temperature vulcanization (RTV) silicone blend (Ecoflex-30; Smooth-On Inc.). I mixed a red-colored pigment (Silc Pig; Smooth-On Inc.) with the silicone to prevent light transmission, minimizing the effect of ambient light on the soft sensor.

Automated Collection of Training Data
To collect training data, I used an array of XY and Z coordinates to sample the volume of the soft touch screen. I attached a probe to the X-carriage of a 3D printer as and mounted the soft sensor device to the print bed. Software written in Processing [3] coordinates the 3D printer’s movement with data collection from the soft sensor. This software uses serial communication to receive data from the soft sensor’s Arduino Due and to send G-code [4] to the printer’s controller, which uses a modified GRBL firmware [5].
I defined the origin as the bottom left corner at the surface of the sensor and recorded measurements every 5mm in the X and Y directions, ranging from 0mm to 75mm. For each XY pair, I recorded measurements at the surface and at depths of 4, 6, 8 and 10mm. At each of these 256 distinct locations, the measurement process repeats five times, yielding 5120 data samples.
For each distinct location, I illuminate four IR LEDs at once as shown below. For each of the eight illumination states, the software measures and records the voltage across all 32 phototransistors. A full measurement cycle yields 256 features, with each voltage represented as an integer from 0 to 1023. The Processing software exports labeled training data as a CSV file that can then be processed using open source machine learning libraries.


Machine Learning
For this project, I performed all machine learning using the caret Package [6] built for R. Prior to any data analysis, I randomly sampled the recorded data and reserved 20% as a testing set. For an initial proof of concept, I used a random forest algorithm. I used 500 trees for each model and the number of variables available for splitting at each tree node (mtry) was tuned using five-fold cross-validation.
Touch Classification
The first model I developed is a classification of whether or not the sensor is being touched. Each of the 5120 data samples are labeled with a Boolean state for touching or not. I randomly reserved 20% of the data as a fixed testing set. Of the remaining training set, I created partitions ranging from 1%-100% of the training data. I then used random forests to build a classifier to predict whether the device is being touched. Classification accuracy results are shown below. Using just 20% (819 samples) of the training data, a classification model achieves an accuracy of 95.1%. Using the full training set (4096 samples), the classification accuracy increases to 98.2%.

Location Prediction
After developing a model for classifying touch, the next step was to build a model to predict the location and depth of the touch. As described for the touch model, I reserved 20% of the available data as a testing set. For this regression problem, I used data for which the Z-depth is 4, 6, 8 or 10mm. This provided a testing set of 816 samples, and an available training set of up to 3280 samples. I varied the size of the training set and fit models for X, Y, and Z location using each subset of the data. The resulting root-mean-square error (RMSE) and training time are shown below. Using just 40% (1312 samples) of the training data, the RMSE for the X and Y location predictions is less than 3mm and the RMSE for the z depth prediction is less than 0.76mm. With the full training set (3280 samples), the RMSE for the X and Y location predictions is less than 1.6mm, and the RMSE for the Z depth prediction is 0.59mm.

The predictions for X, Y, and Z locations are shown below. Each set of predictions is based on models fit using the full training sets. In each figure, the top plot shows the predicted values for each location and the bottom plot shows the difference between predicted and actual values. For the X predictions, the data is split into two sets because the prediction accuracy dramatically decreases for X > 55mm. For X <= 55mm, the magnitude of the prediction error tends to be less than 0.5mm, but increases to nearly 20mm near the right edge of the touch sensor.
For the Y predictions, the magnitude of prediction error tends to be less than 1mm. The outliers, however, then to be skewed towards the center of the touch sensor. Outliers near the bottom of the touch sensor have positive error, while those near the top tend to have negative error. This same trend is evident for the Z predictions. Most predictions for Z however, are within 0.5mm of the nominal value.
X Location Prediction

Y Location Prediction

Z Location Prediction

Conclusions and Future Direction
These initial results show that elastomeric foams coupled with infrared LEDs and phototransistors are a promising technology for creating a soft touch sensor. The accuracy of the preliminary tests are sufficient for many human robot interaction tasks; the RMSE of the predicted location is <1.6mm and the RMSE of the predicted depth is <0.6mm. More sophisticated machine learning algorithms and more training data could further improve these results. Moreover, much of the error in mean values came from outliers. Averaging multiple samples prior to input into the trained model may mitigate the effect of these
outliers. With these improvements, this soft foam touch sensor may imbue robots with a sense of touch rivalling that of humans. This device is of particular interest in robotics due to its flexible form factor and low cost. The elastomeric foams used in this device are easily cast into 3D shapes to form a tactile skin for a soft robot. Furthermore, this initial prototype cost approximately $150, including the cost of custom PCB fabrication. The actual sensors and emitters cost less than $1 each, even when bought in quantities of one.
While this project only tested scenarios with a single press into the foam actuator, it is likely that the device is capable of multi-touch operation. This device may also be suitable for integration into stretchable applications (e.g. soft robotics) where the sensor is stretching in addition to being pressed. More advanced training routines would be needed to decouple device strain from external pressing. Decoupling strain and external stimuli would enable significant improvements in the closed-loop feedback control of soft robotic systems.
References
[1] Mac Murray et al. (2015) Poroelastic foams for simple fabrication of complex soft robots. Advanced Materials.
[2] Sugiura et al. (2011) FuwaFuwa: Detecting shape deformation of soft objects using directional photoreflectivity measurement. UIST.
[3] Processing: https://processing.org/
[4] G-code: https://en.wikipedia.org/wiki/G-code
[5] GRBL: http://bengler.no/grbl
[6] caret Package: http://topepo.github.io/caret/index.html


